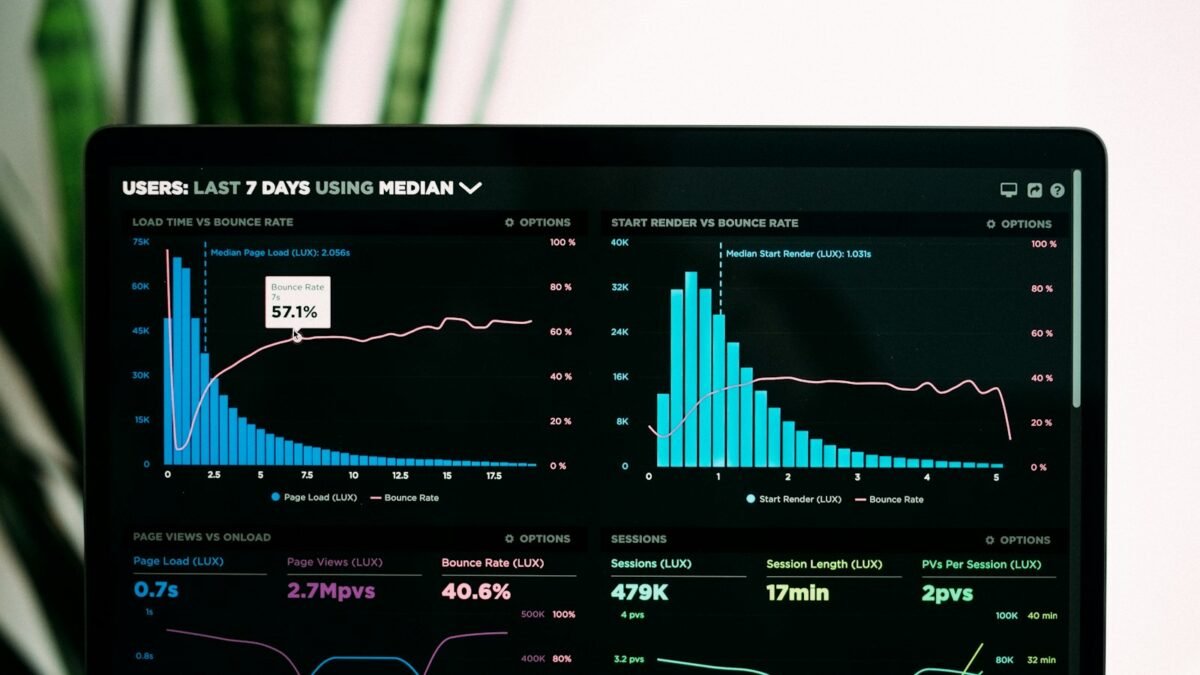
Anthropic has added a feature to its Claude assistant that lets it answer questions with interactive charts, diagrams and small simulations rendered inside the chat rather than as text alone. The capability, announced in the second week of March 2026, means a question about compound growth, a historical trend or a strategy concept can come back as a visual the user can adjust in place.
The feature works in the Claude web and desktop apps. Users can prompt it directly, for example by asking Claude to create an interactive chart about a topic, and Claude will also decide on its own to produce a visualization when it judges that a chart explains something better than prose, according to Anthropic’s description of the feature as reported by The Register and eWeek.
From answers to adjustable models
The examples circulating from the launch illustrate the intent. A user can ask how much capital invested in the S&P 500 would be needed to generate a target monthly income, and Claude returns a chart with sliders for assumptions such as inflation and expected returns, so the user can see how the answer changes under different scenarios. Abstract subjects such as exponential growth in AI compute, basic game theory or opening principles in chess can likewise be turned into step-through visual explainers.
Anthropic frames this as a way to make Claude better at teaching and explaining, and trade coverage has drawn the comparison to a whiteboard that the assistant can draw on during a conversation rather than a separate design canvas.
Sharing and export
Visualizations can be shared through Claude’s existing share button, which generates a link that others can open. Users can also ask Claude to produce the same chart as a complete, self-contained web page, which can be downloaded and hosted anywhere. That makes the output usable in reports, internal wikis or presentations without depending on the Claude app.
The feature builds on Artifacts, the side-panel system Anthropic introduced in 2024 for generating code, documents and small apps. The difference is that the new visualizations appear inline in the conversation and are meant to be lightweight and immediate rather than full projects.
Competitive context
OpenAI’s ChatGPT has offered chart generation through its data analysis tools since 2023, and Google’s Gemini can produce charts in its Canvas mode. Anthropic’s version emphasizes interactivity and explanation over data-file analysis, and reviewers noted that it does not require uploading a spreadsheet to be useful.
The broader trend is that general-purpose AI assistants are absorbing functions that once belonged to dedicated tools, in this case lightweight data visualization and educational simulations. For products that sell exactly those capabilities, the arrival of a comparable feature inside a widely used assistant adds to competitive pressure.